
13 Jul What is the Outlook for U.S. Wavelength Services through 2030?
July 14, 2026
By Rosemary Cochran
Principal & Co-Founder, Vertical Systems Group
Vertical Systems Group’s U.S. Wavelength services outlook based on bandwidth fluctuates through 2030. Our latest research for this time period shows a surge for 400 Gbps and higher speed circuits, growth for 100 Gbps circuits, and erosion for 10 Gbps & lower speeds.
The 400+ Gbps segment has the highest projected bandwidth growth between 2025 and 2030 as shown in the chart. This segment encompasses wavelength circuits above 100 Gbps, and up to 400 Gbps, plus all higher speeds including emergent 800 Gbps and 1 Tbps circuits.
Current demand for 400+Gbps wavelengths is being driven by Hyperscalers and Cloud providers to support AI and other super high bandwidth, low latency applications. Total bandwidth contribution for this segment is projected to increase almost 10x between 2025 and 2030 based on rising demand for 400+ Gbps installs.
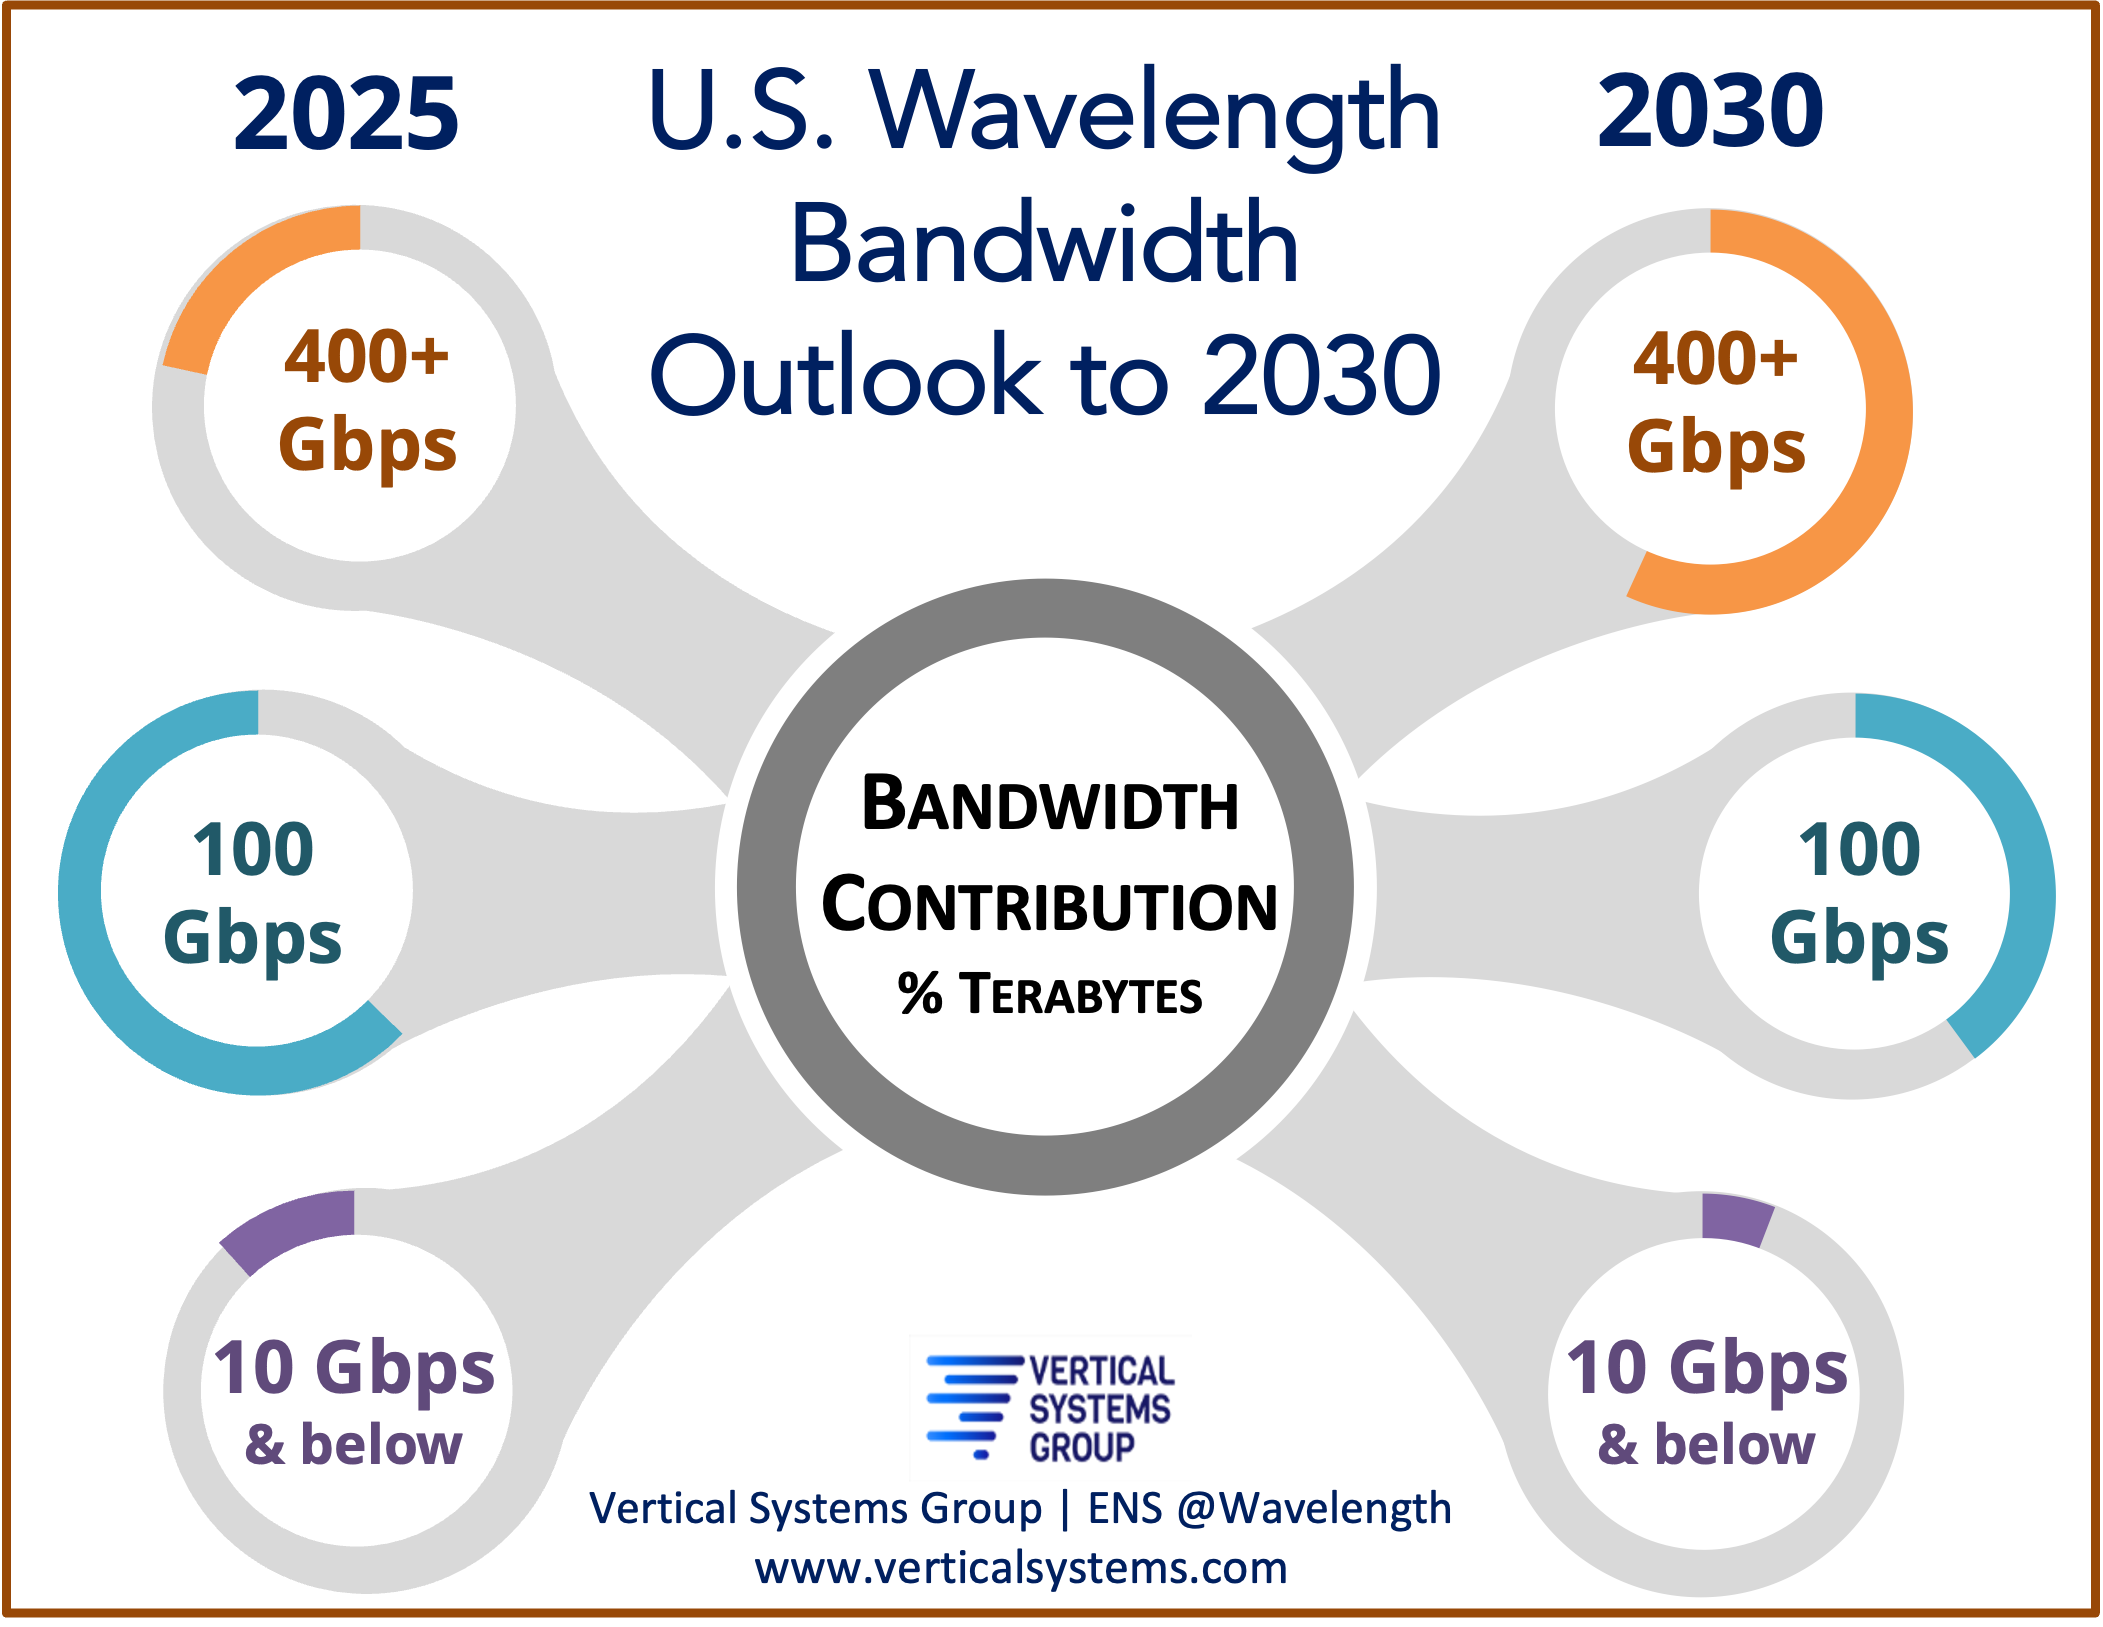
100 Gbps wavelengths include circuits at speeds above 10 Gbps, plus up to and including 100 Gbps. Bandwidth for 100 Gbps wavelengths is projected to increase yearly at double digit rates through 2030. This segment contributed the highest amount of bandwidth overall in 2025, however the outlook to 2030 is a gradual decrease as customer demand shifts to higher speed services. Many enterprises utilize 100 Gbps wavelengths to support applications across vertical industries. Additionally, U.S. network operators are actively purchasing 100 Gbps wavelengths to expand their service footprints.
10 Gbps & Below services cover 10 Gbps circuits and all lower speeds (e.g., 2.5 Gbps, 1 Gbps, etc.). Although demand for wavelength bandwidth at speeds of 2.5 Gbps and lower are declining, the outlook for 10 Gbps bandwidth remains steady. For this segment, bandwidth contributions are eroding as customers upgrade to higher speed wavelengths or choose other network services.
- Note that all bandwidth calculations are based on annually adjusted weighting factors for each speed category. Bandwidth comparisons year-to-year reflect ongoing increases in customer-subscribed port rates.
@Wavelength is available now exclusively by subscription to an ENS Research Program. Research data includes the market share detail that powers the U.S. Wavelength Services LEADERBOARD results – plus detailed data and analysis through 2030 for circuits, revenue and bandwidth by speed. Contact us for more information and pricing.
Source: ENS Research Program excerpts from @Wavelength.